|
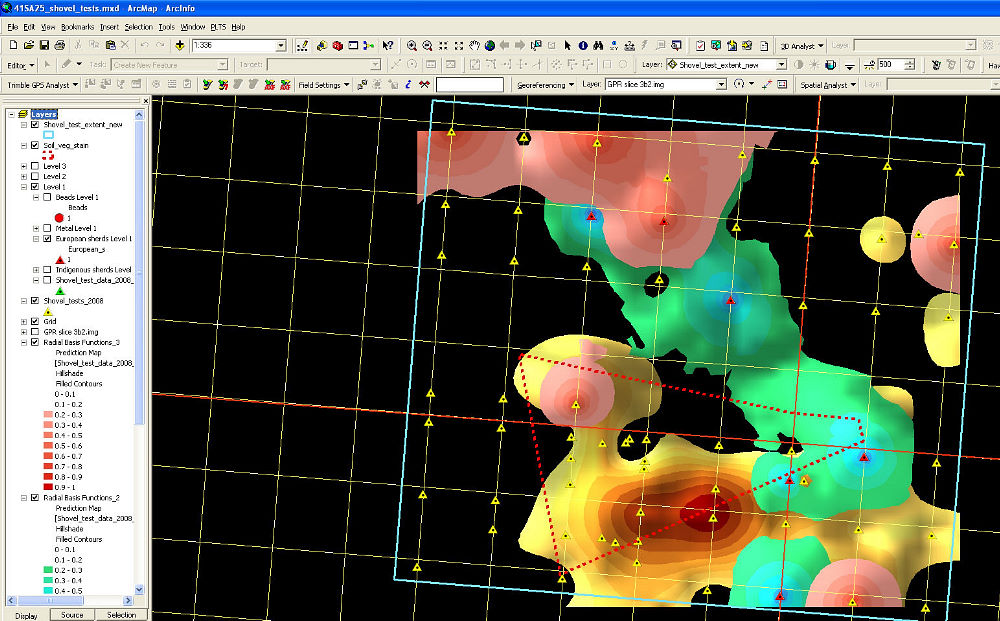
| This screenshot shows GIS spatial analysis of the distribution of aboriginal pottery that is decreasing in probability from brown to yellow, European ceramics decreasing in probability from blue to green, and trade seed beads decreasing in probability from red to pink. Spatial models clearly show that aboriginal pottery clusters near the southern edge of the bright red area on the color infrared aerial photograph (outlined in a dashed red line) while European ceramics form a linear pattern along the east side of the mission area. The trade seed beads cluster into distinct patterns perhaps suggesting beading activity areas. Spatial modeling to show the distribution and frequency of artifacts aids in the interpretation of the site and leads to a better understanding of the use of space by the inhabitants living in and around Mission Dolores. Graphic by Jeff Williams. |